Handle Multiple Remotely Sensed Images
Contents
Learning Objectives
Create mosaics of more than one multiband image
Find the intersection of two images
View the footprint of multiple image tiles
Review
Raster Operations
Handle Multiple Remotely Sensed Images#
Doing analysis over larger areas often requires the use of image mosaics (combining two or more images). Luckily for us geowombat makes this process relatively easy.
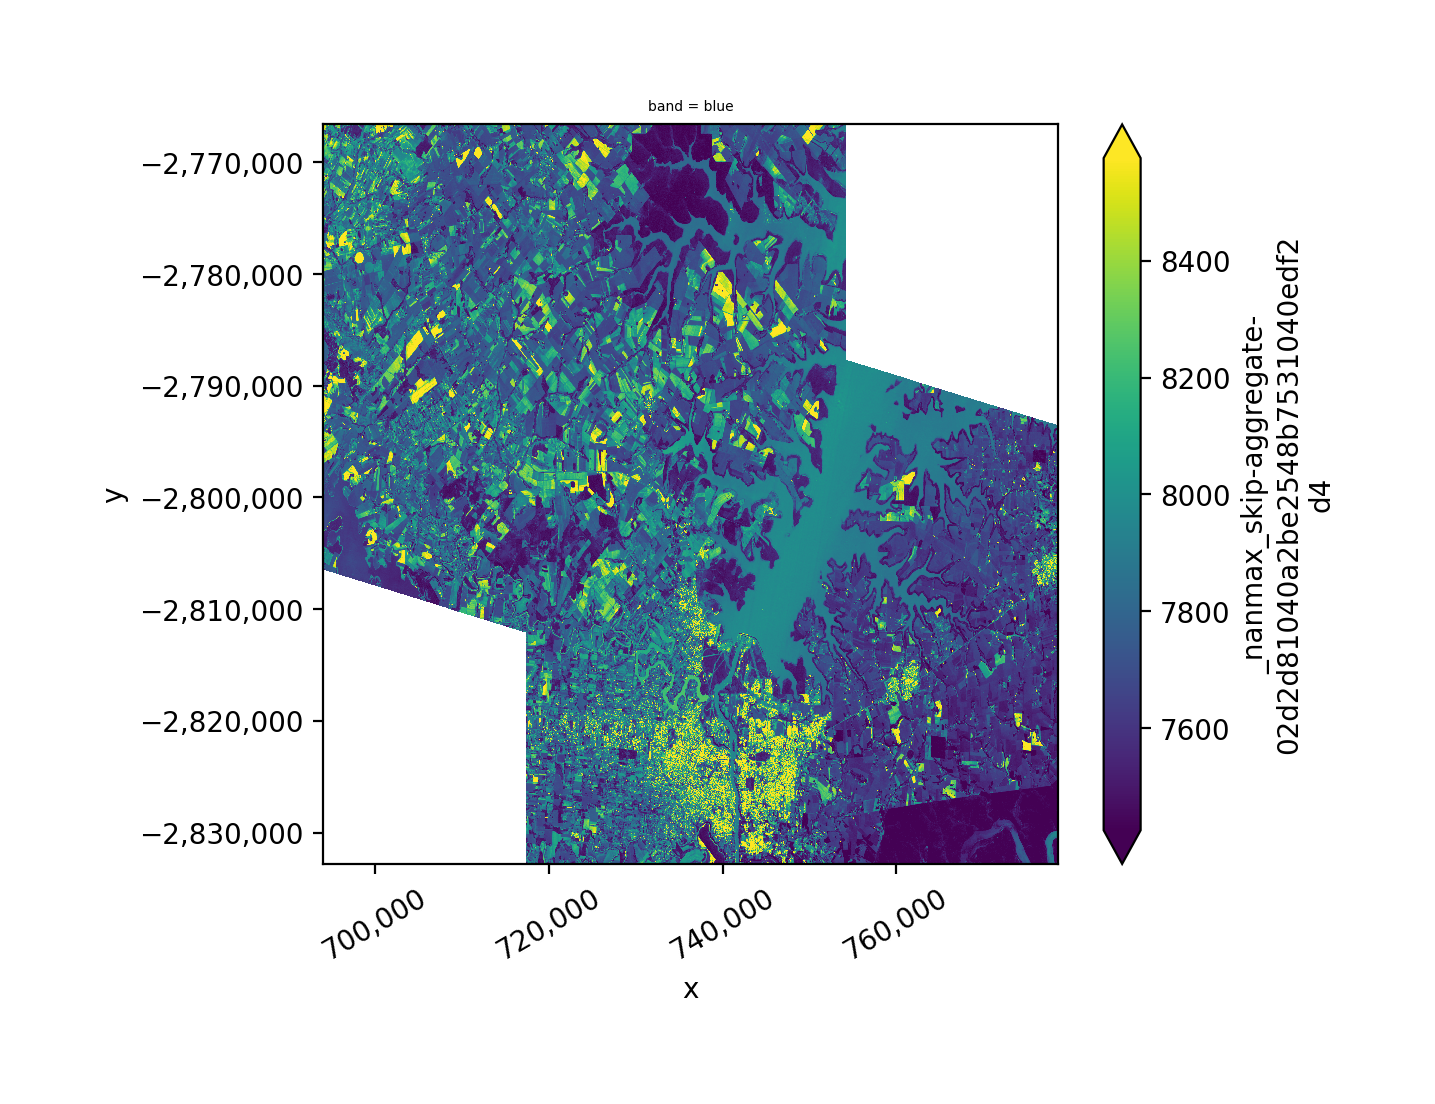
Union (Mosaic) of Remotely Sensed Image#
As an example let’s plot the union with mosaic=True
of two images taken on the same day, for the overlapping portions we will use the mean pixel value by setting overlap='mean'
, but blue band only. Alternatively we could use one of ‘mean’, ‘min’, or ‘max’.
Note we rename the band name with band_names=['blue']
.
# Import GeoWombat
import geowombat as gw
# import plotting
import matplotlib.pyplot as plt
import matplotlib.patheffects as pe
# load data
from geowombat.data import l8_224077_20200518_B2, l8_224078_20200518_B2
fig, ax = plt.subplots(dpi=200)
filenames = [l8_224077_20200518_B2, l8_224078_20200518_B2]
with gw.open(filenames,
band_names=['blue'],
mosaic=True,
overlap = 'mean',
bounds_by='union') as src:
src.where(src != 0).sel(band='blue').plot.imshow(robust=True, ax=ax)
plt.tight_layout(pad=1)

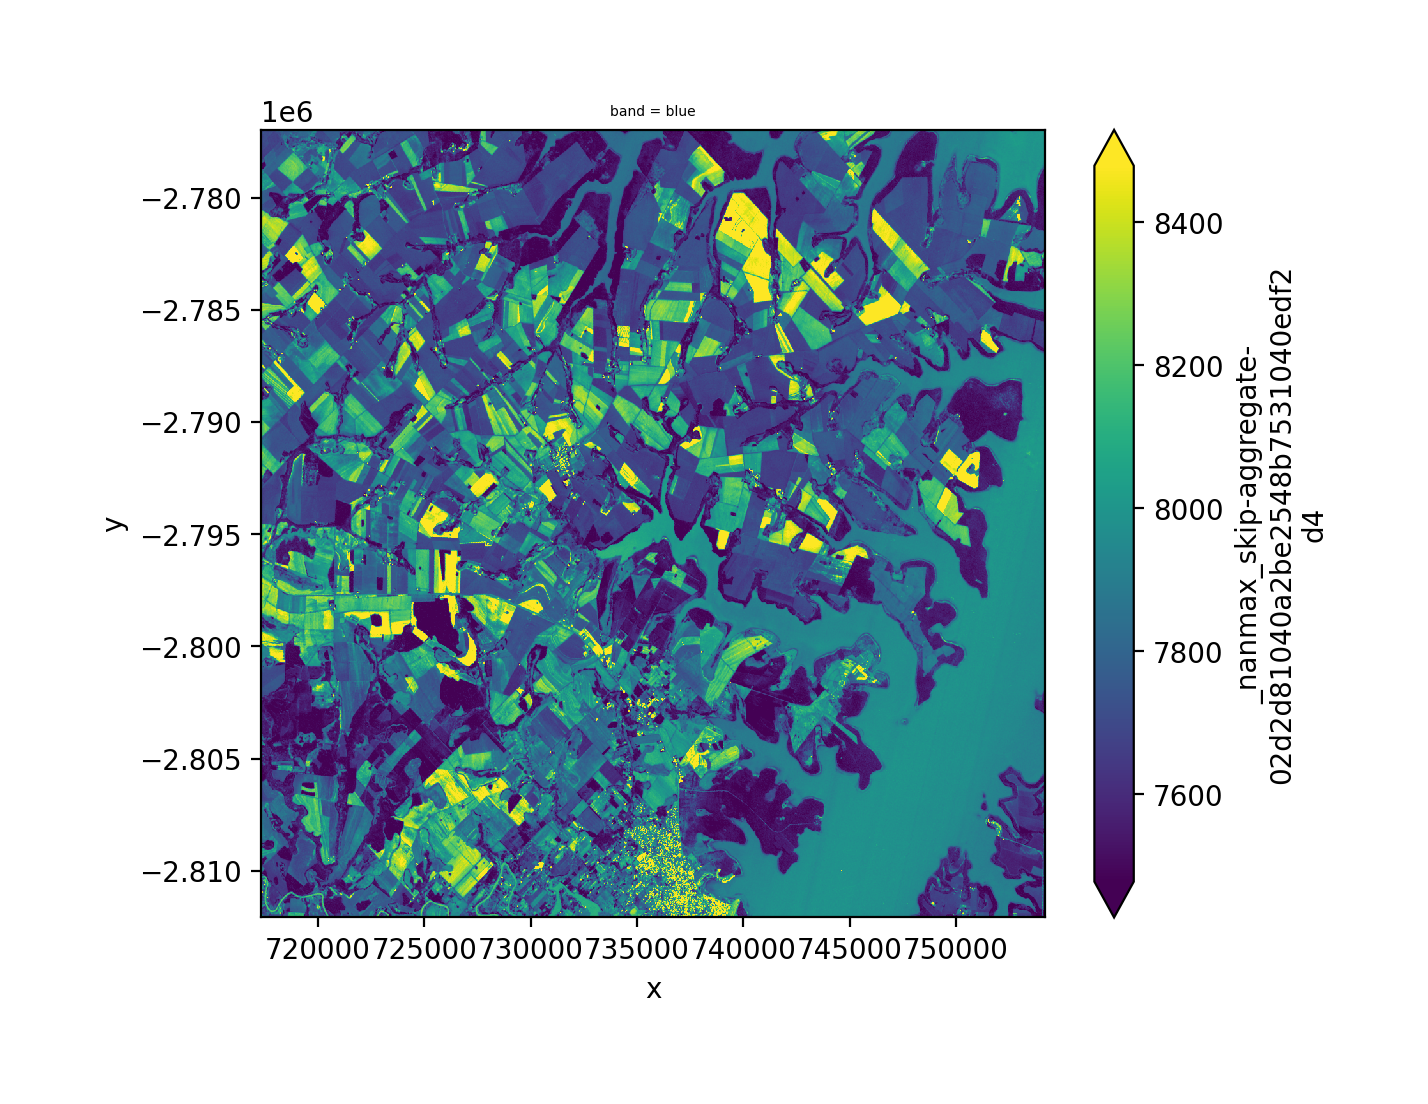
Intersection of Remotely Sensed Image#
Same idea with the intersection, using bounds_by='intersection'
, we still need to mosaic the two images mosaic=True
.
fig, ax = plt.subplots(dpi=200)
filenames = [l8_224077_20200518_B2, l8_224078_20200518_B2]
with gw.open(filenames,
band_names=['blue'],
mosaic=True,
overlap='mean',
bounds_by='intersection') as src:
src.where(src != 0).sel(band='blue').plot.imshow(robust=True, ax=ax)
plt.tight_layout(pad=1)

View Image Tile Footprints#
Here we set up a more complicated plotting function for near IR ‘nir’. Note the use of footprint_grid
.
from geowombat.data import l8_224077_20200518_B4, l8_224078_20200518_B4
def plot(bounds_by, ref_image=None, cmap='viridis'):
fig, ax = plt.subplots(dpi=200)
with gw.config.update(ref_image=ref_image):
with gw.open([l8_224077_20200518_B4, l8_224078_20200518_B4],
band_names=['nir'],
chunks=256,
mosaic=True,
bounds_by=bounds_by) as srca:
# Plot the NIR band
srca.where(srca != 0).sel(band='nir').plot.imshow(robust=True, cbar_kwargs={'label': 'DN'}, ax=ax)
# Plot the image chunks
srca.gw.chunk_grid.plot(color='none', edgecolor='k', ls='-', lw=0.5, ax=ax)
# Plot the image footprints
srca.gw.footprint_grid.plot(color='none', edgecolor='orange', lw=2, ax=ax)
# Label the image footprints
for row in srca.gw.footprint_grid.itertuples(index=False):
ax.scatter(row.geometry.centroid.x, row.geometry.centroid.y,
s=50, color='red', edgecolor='white', lw=1)
ax.annotate(row.footprint.replace('.TIF', ''),
(row.geometry.centroid.x, row.geometry.centroid.y),
color='black',
size=8,
ha='center',
va='center',
path_effects=[pe.withStroke(linewidth=1, foreground='white')])
# Set the display bounds
ax.set_ylim(srca.gw.footprint_grid.total_bounds[1]-10, srca.gw.footprint_grid.total_bounds[3]+10)
ax.set_xlim(srca.gw.footprint_grid.total_bounds[0]-10, srca.gw.footprint_grid.total_bounds[2]+10)
title = f'Image {bounds_by}' if bounds_by else str(Path(ref_image).name.split('.')[0]) + ' as reference'
size = 12 if bounds_by else 8
ax.set_title(title, size=size)
plt.tight_layout(pad=1)
The two plots below illustrate how two images can be mosaicked. The orange grids highlight the image footprints while the black grids illustrate the DataArray
chunks.
plot('union')
