Accessing Census and ACS Data in Python using `pytidycensus#
By: Steven Chao & Michael Mann
Learning Objectives
Import dataframes into Python for analysis
Perform basic dataframe column operations
Merge dataframes using a unique key
Group attributes based on a similar attribute
Dissolve vector geometries based on attribute values
Review
Introduction#
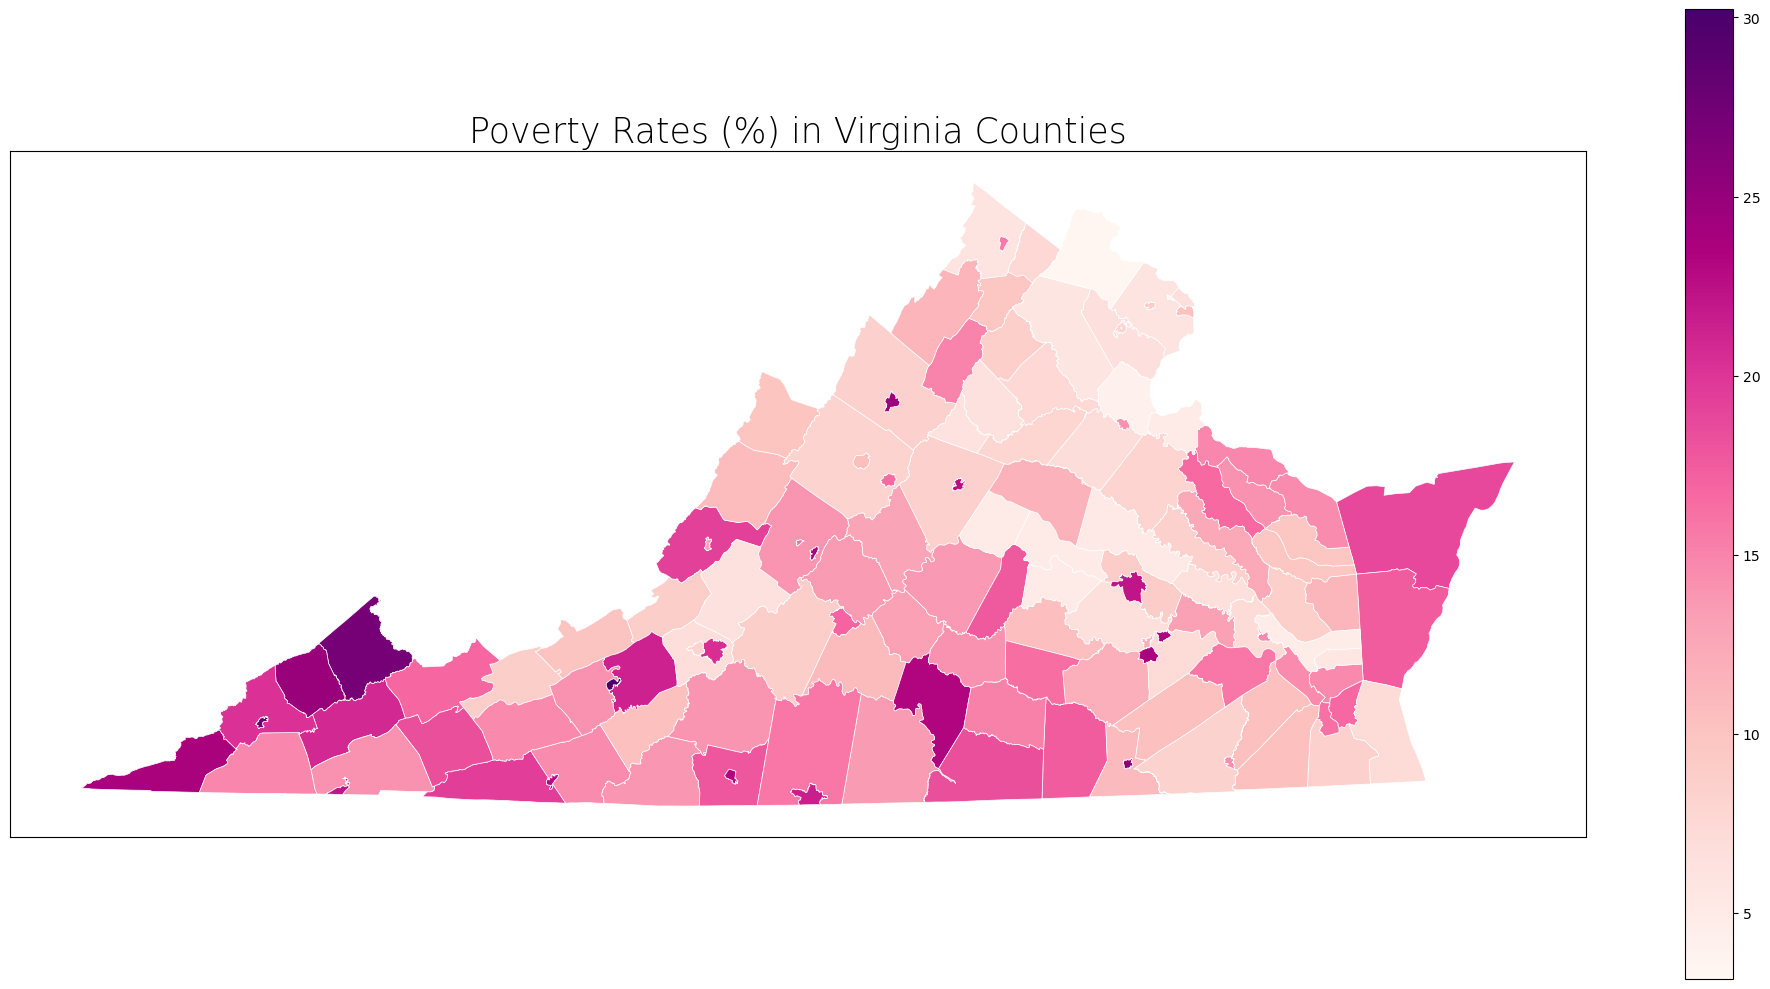
This chapter will show you how to access US Decennial Census and American Community Survey Data (ACS). We will use these basic operations in order to calculate and map poverty rates in the Commonwealth of Virginia. We will pull data from the US Census Bureau’s American Community Survey (ACS) 2019 (see this page for the data).
For a detailed list of variable explainations, visit https://censusreporter.org/topics/table-codes/.
# Import modules
import matplotlib.pyplot as plt
import pandas as pd
import geopandas as gpd
import pytidycensus as tc
import os
Accessing Data#
Import census data#
Let’s begin by accessing and importing census data. Importing census data into Python using pytidycensus requires a Census API key. A key can be obtained from Census API Key. It will provide you with a unique 40 digit text string. Please keep track of this number. Store it in a safe place.
# Set API key for pytidycensus
tc.set_census_api_key("CENSUS API KEY HERE")
Show code cell content
# ignore this, I am just reading in my api key privately
import yaml
import os

def get_credentials():
    try:
        with open('credentials.yaml') as f:
            return yaml.safe_load(f)
    except FileNotFoundError:
        return {}

creds = get_credentials()
api_key = creds.get('census_api_key') or os.environ.get('CENSUS_API_KEY')
tc.set_census_api_key(api_key)
Census API key has been set for this session.
With the Census API key set, we will access the census data at the tract level for the Commonwealth of Virginia from the 2019 ACS, specifically the ratio of income to poverty in the past 12 months (C17002_001E, total; C17002_002E, < 0.50; and C17002_003E, 0.50 - 0.99) variables and the total population (B01003_001E) variable. For more information on why these variables are used, refer to the US Census Bureau’s article on how the Census Bureau measures poverty and the list of variables found in ACS.
The pytidycensus package provides us with clean, convenient methods to obtain data for a wide variety of geographies. We can simply specify the state name (e.g., “Virginia” or “VA”) without needing to look up FIPS codes.
# Obtain Census variables from the 2019 ACS at the tract level for the Commonwealth of Virginia
# C17002_001E: count of ratio of income to poverty in the past 12 months (total)
# C17002_002E: count of ratio of income to poverty in the past 12 months (< 0.50)
# C17002_003E: count of ratio of income to poverty in the past 12 months (0.50 - 0.99)
# B01003_001E: total population
# Sources: https://api.census.gov/data/2019/acs/acs5/variables.html
va_census = tc.get_acs(
    geography="tract",
    variables=["C17002_001E", "C17002_002E", "C17002_003E", "B01003_001E"],
    state="VA",
    year=2019,
    output="wide"
)
Getting data from the 2015-2019 5-year ACS
The pytidycensus package returns data as pandas DataFrames by default, so our data is already in the correct format.
# Show the dataframe (already a pandas DataFrame)
print(va_census.head(2))
print('Shape: ', va_census.shape)
         GEOID  C17002_001E  C17002_002E  C17002_003E  B01003_001E state  \
0  51065020200         4804          197          146         4863    51
1  51059460702         4578           58           30         4578    51

  county   tract                       NAME  C17002_001_moe  C17002_002_moe  \
0    065  020200  Fluvanna County, Virginia           387.0           144.0
1    059  460702   Fairfax County, Virginia           239.0            62.0

   C17002_003_moe B01003_001_moe
0           111.0          383.0
1            27.0          239.0
Shape:  (1907, 13)
By showing the dataframe, we can see that there are 1907 rows (therefore 1907 census tracts) and 8 columns.
Notice that for each variable we get two columns: one with the estimate (e.g., C17002_001E) and one with the margin of error (e.g., C17002_001_moe). For this analysis, we will only use the estimate columns.
Add Geographic Boundaries#
Instead of manually downloading shapefiles, we can use pytidycensus to automatically retrieve the geographic boundaries along with our census data. Let’s get the same tract-level data but this time with geometry included:
# Get census data with geometric boundaries included
va_tract = tc.get_acs(
    geography="tract",
    variables=["C17002_001E", "C17002_002E", "C17002_003E", "B01003_001E"],
    state="VA",
    year=2019,
    output="wide",
    geometry=True
)

# Reproject to UTM Zone 17N for better area calculations
# https://spatialreference.org/ref/epsg/wgs-84-utm-zone-17n/
va_tract = va_tract.to_crs(epsg=32617)

# Print GeoDataFrame
print(va_tract.head(2))
print('Shape: ', va_tract.shape)

# Check projection
print("\nThe projection is: {}".format(va_tract.crs))
Getting data from the 2015-2019 5-year ACS
Loading tract boundaries...
         GEOID                                           geometry  \
0  51700032132  POLYGON ((897174.191 4119897.084, 897174.811 4...
1  51700032226  POLYGON ((893470.562 4123469.385, 893542.722 4...

   C17002_001E  C17002_002E  C17002_003E  B01003_001E state county   tract  \
0         4997          208          182         4997    51    700  032132
1         4483          625          739         4490    51    700  032226

                          NAME  C17002_001_moe  C17002_002_moe  \
0  Newport News city, Virginia           426.0           115.0
1  Newport News city, Virginia           453.0           463.0

   C17002_003_moe B01003_001_moe
0           219.0          426.0
1           381.0          454.0
Shape:  (1907, 14)

The projection is: epsg:32617
Perfect! With pytidycensus, we now have both the census data and the geographic boundaries in a single GeoDataFrame. This eliminates the need to merge separate datasets since the census data and geometry are already connected.
Performing Dataframe Operations#
Since we’re using pytidycensus, our data already comes with all the necessary geographic identifiers and is ready for analysis. Let’s clean up the data and prepare it for our poverty analysis.
Aggregate tract data to county level#
Next, we will group all the census tracts within the same county and aggregate the poverty and population values for those tracts within the same county. We can use the dissolve function in GeoPandas, which is the spatial version of groupby in pandas. We use dissolve instead of groupby because the former also groups and merges all the geometries (in this case, census tracts) within a given group (in this case, counties).
To control which columns are aggregated and how they are aggregated, we can use the aggfunc parameter. In this case, we want to sum up the poverty counts and population values for all the census tracts within each county.
# Extract county FIPS from GEOID (first 5 characters: state + county)
va_tract['COUNTYFP'] = va_tract['GEOID'].str[:5]

# Dissolve and group the census tracts within each county and aggregate all the values together  https://geopandas.org/docs/user_guide/aggregation_with_dissolve.html

va_poverty_county = va_tract.dissolve(by='COUNTYFP', aggfunc={'C17002_001E': 'sum',
                                                              'C17002_002E': 'sum',
                                                              'C17002_003E': 'sum',
                                                              'B01003_001E': 'sum'})


# Show dataframe
print(va_poverty_county.head(2))
print('Shape: ', va_poverty_county.shape)
                                                   geometry  C17002_001E  \
COUNTYFP
51001     POLYGON ((971814.409 4160130.005, 971664.507 4...        32325
51003     POLYGON ((722871.236 4189239.708, 722813.526 4...       100293

          C17002_002E  C17002_003E  B01003_001E
COUNTYFP
51001            2352         3789        32673
51003            5034         4108       107405
Shape:  (133, 5)
Notice that we got the number of rows down from 1907 to 133.
Calculate poverty rates#
We can estimate the poverty rate by dividing the sum of C17002_002E (ratio of income to poverty in the past 12 months, < 0.50) and C17002_003E (ratio of income to poverty in the past 12 months, 0.50 - 0.99) by B01003_001E (total population).
Side note: Notice that C17002_001E (ratio of income to poverty in the past 12 months, total), which theoretically should count everyone, does not exactly match up with B01003_001E (total population). We’ll disregard this for now since the difference is not too significant.
# Calculate poverty rate and store values in new column
va_poverty_county["Poverty_Rate"] = (
    (va_poverty_county["C17002_002E"] + va_poverty_county["C17002_003E"]) /
    va_poverty_county["B01003_001E"] * 100
)

# Show dataframe
va_poverty_county.head(2)
| geometry | C17002_001E | C17002_002E | C17002_003E | B01003_001E | Poverty_Rate | |
|---|---|---|---|---|---|---|
| COUNTYFP | ||||||
| 51001 | POLYGON ((971814.409 4160130.005, 971664.507 4... | 32325 | 2352 | 3789 | 32673 | 18.795336 |
| 51003 | POLYGON ((722871.236 4189239.708, 722813.526 4... | 100293 | 5034 | 4108 | 107405 | 8.511708 |
Plotting Results#
Finally, since we have the spatial component connected to our census data using pytidycensus, we can plot the results! The integration of geometry with census data makes mapping straightforward.
# Create subplots
fig, ax = plt.subplots(1, 1, figsize=(20, 10))

# Plot data
# Source: https://geopandas.readthedocs.io/en/latest/docs/user_guide/mapping.html
va_poverty_county.plot(
    column="Poverty_Rate",
    ax=ax,
    cmap="RdPu",
    legend=True,
    edgecolor='white',
    linewidth=0.5
)

# Stylize plots
plt.style.use('bmh')

# Set title
ax.set_title('Poverty Rates (%) in Virginia Counties',
             fontdict={'fontsize': '25', 'fontweight': '3'})

# Remove axis ticks for cleaner look
ax.set_xticks([])
ax.set_yticks([])

# Show the plot
plt.tight_layout()
plt.show()

Summary#
This tutorial demonstrated how to use pytidycensus to:
Easily access Census data: Set up API key and retrieve ACS data with a simple function call
Integrate spatial data: Automatically include geometric boundaries with
geometry=TrueEliminate data merging: Get census attributes and geography in a single step
Perform spatial analysis: Use standard pandas/geopandas operations on the integrated data
Create effective visualizations: Map results directly without complex data preparation
Key advantages of using pytidycensus:
Simplified workflow: No need to download separate shapefiles or perform complex merges
Consistent data format: Returns familiar pandas DataFrames and GeoPandas GeoDataFrames
Built-in geography: TIGER/Line boundaries automatically aligned with census data
Flexible output: Choose between tidy and wide formats based on analysis needs
Comprehensive coverage: Support for multiple census datasets (ACS, Decennial, Population Estimates)
