Learning Objectives
Download and utilize OpenStreetMap data
Accessing OSM Data in Python#
What is OpenStreetMap?#
OpenStreetMap (OSM) is a global collaborative (crowd-sourced) dataset and project that aims at creating a free editable map of the world containing a lot of information about our environment [1]. It contains data for example about streets, buildings, different services, and landuse to mention a few. You can view the map at www.openstreetmap.org. You can also sign up as a contributor if you want to edit the map. More details about OpenStreetMap and its contents are available in the OpenStreetMap Wiki.
OSMnx#
This week we will explore a Python module called OSMnx that can be used to retrieve, construct, analyze, and visualize street networks from OpenStreetMap, and also retrieve data about Points of Interest such as restaurants, schools, and lots of different kind of services. It is also easy to conduct network routing based on walking, cycling or driving by combining OSMnx functionalities with a package called NetworkX.
To get an overview of the capabilities of the package, see an introductory video given by the lead developer of the package, Prof. Geoff Boeing: “Meet the developer: Introduction to OSMnx package by Geoff Boeing”.
Download and visualize OpenStreetMap data with OSMnx#
One the most useful features that OSMnx provides is an easy-to-use way of retrieving OpenStreetMap data (using OverPass API).
In this tutorial, we will learn how to download and visualize OSM data covering a specified area of interest: the neighborhood of Edgewood in Washington DC USA.
# Specify the name that is used to seach for the data
place_name = "Edgewood Washington, DC, USA"
OSM Location Boundary#
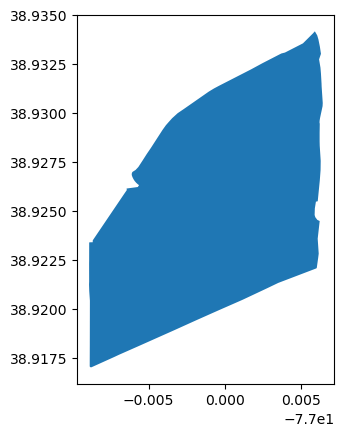
Let’s also plot the Polygon that represents the boundary of our area of interest (Washington DC). We can retrieve the Polygon geometry using the ox.geocode_to_gdf docs function.
# import osmnx
import osmnx as ox
import geopandas as gpd

# Get place boundary related to the place name as a geodataframe
area = ox.geocode_to_gdf(place_name)
As the name of the function already tells us, geocode_to_gdf()returns a GeoDataFrame based on the specified place name query.
# Check the data type
area
| geometry | bbox_west | bbox_south | bbox_east | bbox_north | place_id | osm_type | osm_id | lat | lon | display_name | class | type | importance | |
|---|---|---|---|---|---|---|---|---|---|---|---|---|---|---|
| 0 | POLYGON ((-77.00892 38.92123, -77.0089 38.9208... | -77.008915 | 38.917008 | -76.99358 | 38.934159 | 282956700 | relation | 4634158 | 38.922613 | -77.000537 | Edgewood, Washington, District of Columbia, Un... | place | neighbourhood | 0.47 |
Let’s still verify the data type:
# Check the data type
type(area)
geopandas.geodataframe.GeoDataFrame
Finally, let’s plot it.
area.plot()
<Axes: >

OSM Building footprints#
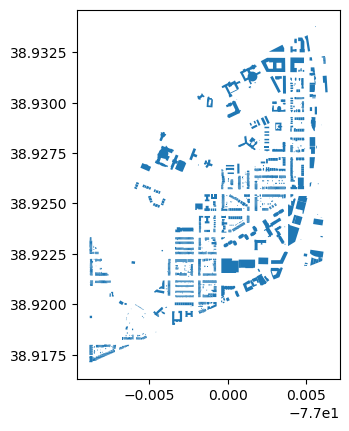
It is also possible to retrieve other types of OSM data features with OSMnx such as buildings or points of interest (POIs). Let’s download the buildings with ox.features_from_place docs function and plot them on top of our street network in Kamppi.
When fetching spesific types of features from OpenStreetMap using OSMnx features_from_place we also need to specify the correct tags. For getting all types of buildings, we can use the tag building=yes.
# List key-value pairs for tags
tags = {'building': True}

buildings = ox.features_from_place(place_name, tags)
buildings.head()
| geometry | addr:state | amenity | building | ele | gnis:county_id | gnis:county_name | gnis:created | gnis:edited | gnis:feature_id | ... | FEATURECOD | shop | denomination | old_name | url | wikidata | office | short_name | shelter_type | type | ||
|---|---|---|---|---|---|---|---|---|---|---|---|---|---|---|---|---|---|---|---|---|---|---|
| element | id | |||||||||||||||||||||
| node | 358955022 | POINT (-76.99845 38.9313) | DC | school | yes | 60 | 001 | District of Columbia | 12/18/1979 | 01/22/2008 | 2062869 | ... | NaN | NaN | NaN | NaN | NaN | NaN | NaN | NaN | NaN | NaN |
| 367143640 | POINT (-77.00417 38.9275) | DC | NaN | yes | 56 | NaN | District of Columbia | NaN | NaN | 2110453 | ... | NaN | NaN | NaN | NaN | NaN | NaN | NaN | NaN | NaN | NaN | |
| relation | 3458715 | POLYGON ((-77.00108 38.92977, -77.00135 38.929... | NaN | NaN | residential | NaN | NaN | NaN | NaN | NaN | NaN | ... | NaN | NaN | NaN | NaN | NaN | NaN | NaN | NaN | NaN | multipolygon |
| 3943248 | POLYGON ((-77.00097 38.92053, -77.00097 38.920... | NaN | NaN | yes | NaN | NaN | NaN | NaN | NaN | NaN | ... | NaN | NaN | NaN | NaN | NaN | NaN | NaN | NaN | NaN | multipolygon | |
| 3943249 | POLYGON ((-77.00113 38.92034, -77.00116 38.920... | NaN | NaN | yes | NaN | NaN | NaN | NaN | NaN | NaN | ... | NaN | NaN | NaN | NaN | NaN | NaN | NaN | NaN | NaN | multipolygon |
5 rows × 53 columns
We can plot the footprints quickly.
# Plot footprints
buildings.plot()
<Axes: >

OSM Write Features to .shp#
Now let’s assume we want to access this data outside of python, or have a permanent copy of our building footprints for Edgewood.
Since these objects are already geopandas.GeoDataFrame it’s easy to save them to disk. We simply use gpd.to_file docs.
Important
We can’t write OSM GeoDataFrames directly to disk because they contain field types (like lists) that can’t be saved in .shp or .geojsons etc. Instead lets isolate only the attributes we are interested in, including geometry which is required.
We need to isolate just the attributes we are interested in:
buildings = buildings.loc[:,buildings.columns.str.contains('addr:|geometry')]
Important
OSM data often contains multiple feature types like mixing points with polygons. This is a problem when we try to write it to disk.
We also need to isolate the feature type we are looking for [e.g. Multipolygon, Polygon, Point]. Since here we want building footprints we are going to keep only polygons.
buildings = buildings.loc[buildings.geometry.type=='Polygon']
Now, finally, we can write it to disk.
# Save footprints
buildings.to_file('../temp/edgewood_buildings.shp')
# Or save in a more open source format
#buildings.to_file('../temp/edgewood_buildings.geojson', driver='GeoJSON')
/tmp/ipykernel_2679025/2776310115.py:2: UserWarning: Column names longer than 10 characters will be truncated when saved to ESRI Shapefile.
  buildings.to_file('../temp/edgewood_buildings.shp')
/home/mmann1123/miniconda3/envs/pygis/lib/python3.11/site-packages/pyogrio/raw.py:723: RuntimeWarning: Normalized/laundered field name: 'addr:state' to 'addr_state'
  ogr_write(
/home/mmann1123/miniconda3/envs/pygis/lib/python3.11/site-packages/pyogrio/raw.py:723: RuntimeWarning: Normalized/laundered field name: 'addr:city' to 'addr_city'
  ogr_write(
/home/mmann1123/miniconda3/envs/pygis/lib/python3.11/site-packages/pyogrio/raw.py:723: RuntimeWarning: Normalized/laundered field name: 'addr:country' to 'addr_count'
  ogr_write(
/home/mmann1123/miniconda3/envs/pygis/lib/python3.11/site-packages/pyogrio/raw.py:723: RuntimeWarning: Normalized/laundered field name: 'addr:housenumber' to 'addr_house'
  ogr_write(
/home/mmann1123/miniconda3/envs/pygis/lib/python3.11/site-packages/pyogrio/raw.py:723: RuntimeWarning: Normalized/laundered field name: 'addr:postcode' to 'addr_postc'
  ogr_write(
/home/mmann1123/miniconda3/envs/pygis/lib/python3.11/site-packages/pyogrio/raw.py:723: RuntimeWarning: Normalized/laundered field name: 'addr:street' to 'addr_stree'
  ogr_write(
Sources
