
Learning Objectives
Assign a projection to vector data
Reproject vector data
Vector Coordinate Reference Systems (CRS)#
When it comes to coordinate reference systems points, lines and polygons are convenient because each point or node has an assigned coordinate pair (x,y). The only trick then is to know how those coordinates relate to the coordinate space, or location on the ground.
Define a Projection for Points, Lines, Polygons#
When a point, line or polyon is created each point or node has two coordinates x and y. The location of these two points on the ground will change wildly between projections. The coordinate pair (0,0) might mean a location just off shore from Ghana with WGS84 LatLon, or in the middle of the Pacific ocean in another.
Let’s take a look at the example of a polygon with coordinates (0,45),(5,45),(5,40),(0,40) below. In the left pane we can see that, although we have the polygon’s node coordinates, we don’t know where they are located! This is because no coordinate reference system has been assigned to it. Could be in outer space for all we know. On the right, we can see that we have assigned it WGS84 geographic lat lon i.e. EPSG:4326. Suddenly the coordinates make sense, because we know how they relate to locations on the ground.
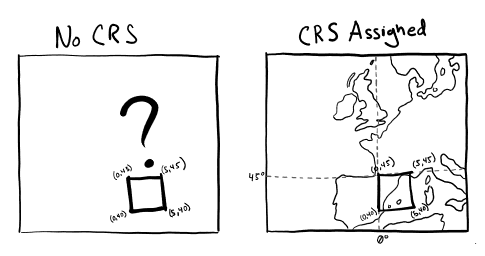
Fig. 39 Example of assigning a coordinate reference system#
Every time we create vector data (or receive it from someone else), we need to make sure that a projection is assigned to it.
The following demonstrates how to
import geopandas as gpd
from shapely.geometry import Point, Polygon
import matplotlib.pyplot as plt
plt.style.use('bmh')

a_square = {'name': ['Washington\n(38.90, -77.03)' ],
     'geometry': [Polygon([Point(0,45), Point(5,45), Point(5,40), Point(0,40)])]}

# create a dataframe from the nodes and assign the CRS
gdf_square = gpd.GeoDataFrame(a_square, crs="EPSG:4326")
fig, ax = plt.subplots(figsize=(12, 6))
gdf_square.plot(ax=ax)
plt.ylim(38, 50)
plt.xlim(0, 20)
plt.show()
Note
Take a moment to review proj4 string and EPSG codes here
Reproject Points, Lines, Polygons#
Once a projection is assigned we often have to ‘reproject’ it to another one. Reprojection entails using a set of formulas to convert (x,y) stored in latitude and longitude into another coordinate space. This entails a two step process.
Looking at the example below, we will move from Sinosoidal to Hobo-Dyer. The first step however is to use the “inverse equation” to convert coordinate pairs from Sinosoidal back to lat lon, and the use the forward equation to convert lat lon into the Hobo-Dyer coordinate space.
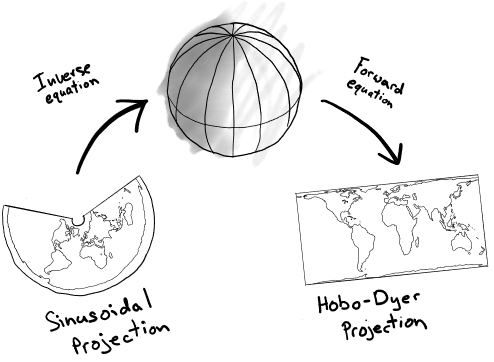
Fig. 40 Reprojecting vectors with inverse and forward equations#
These ‘forward’ and ‘inverse’ equations can be simple or complex. To make things easy to understand lets look at the example of reprojecting from proj4 code +proj=longlat +datum=WGS84 to +proj=longlat +datum=WGS84 +lon_0=-10, where +lon_0=-10 just moves the prime meridian 10 degrees west (west is negative). Because we are already in latitude and longitude we can ignore the ‘inverse’ equation and just look at the ‘forward’ equation.
In this case the ‘forward’ equation is very simple:
As result the polygon remains in the same location, but in the ‘new’ projection longitude values are now all 10 degrees higher.
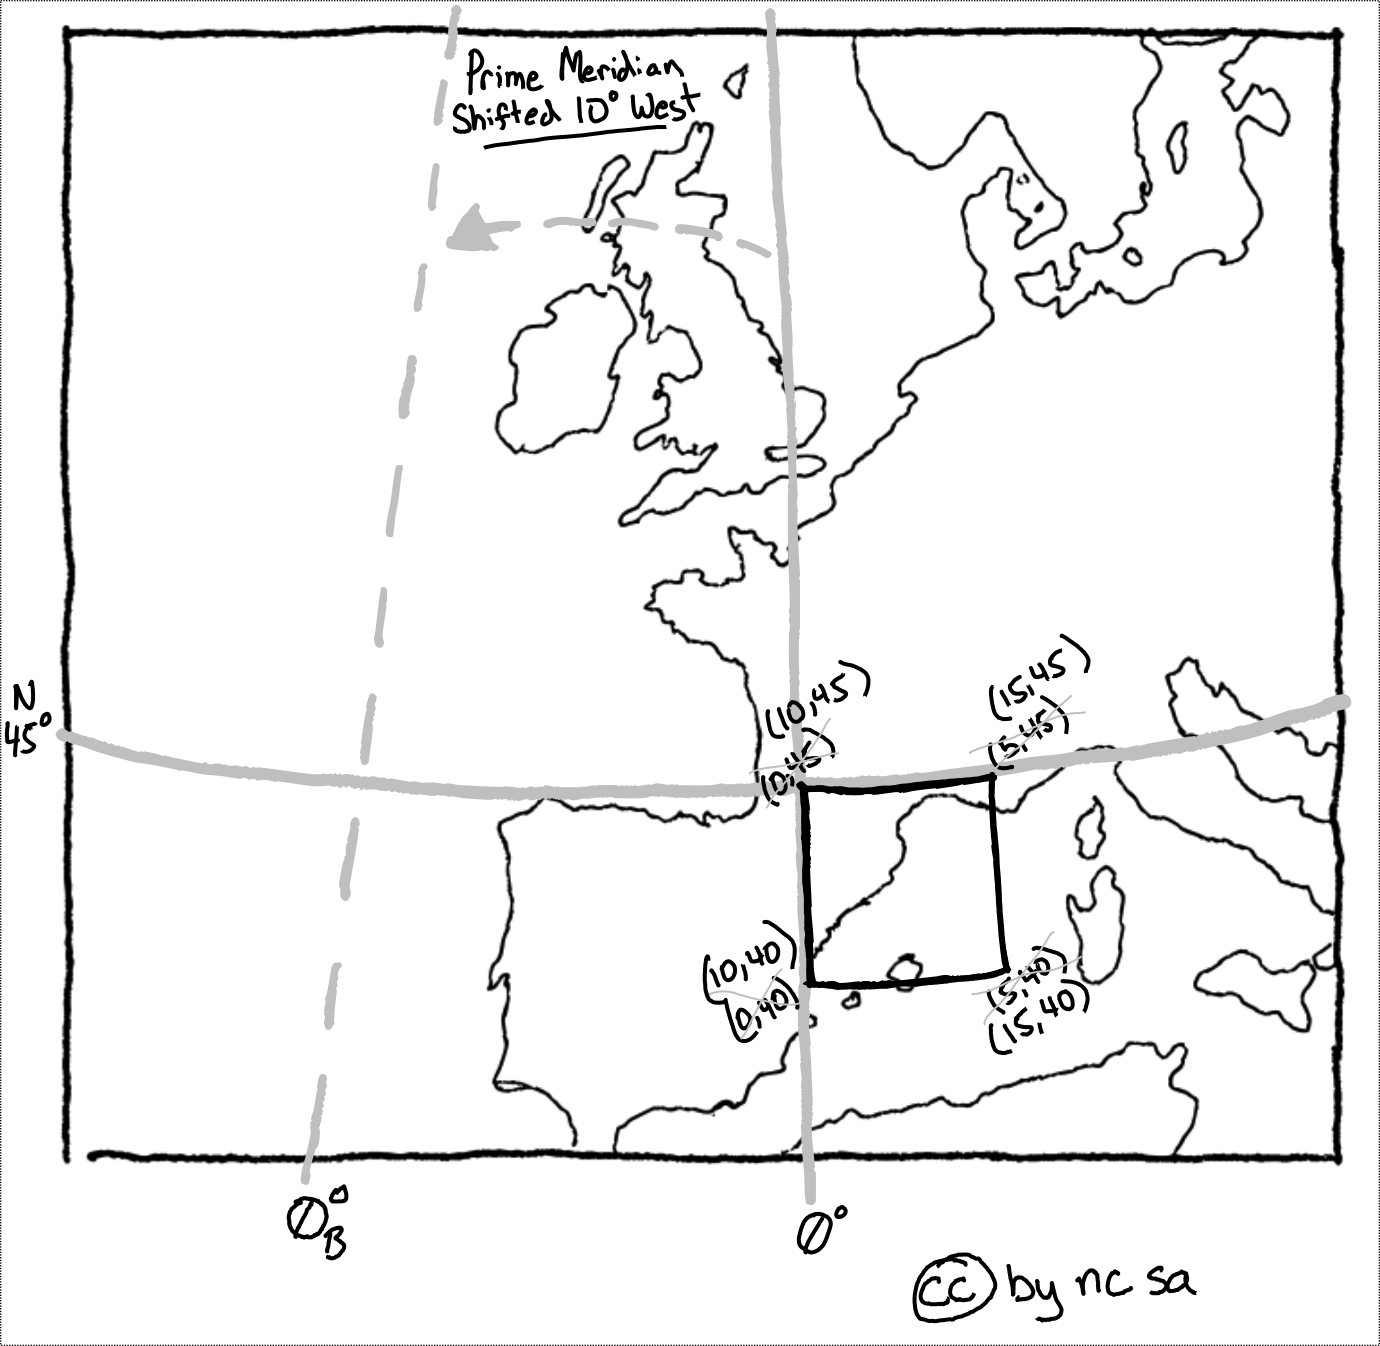
Fig. 41 Reprojecting by moving the prime meridian west#
Most ‘forward’ and ‘inverse’ equations are non-linear and more complex. Take for instance the Gall-Peters forward projection equations are shown below:
where \(\lambda\) is the longitude from the central meridian in degrees, \(\varphi\) is the latitude, and R is the radius of the globe used as the model of the earth for projection. Luckily computers make all these calculation quick and easy.
Refering back to our previous example, let’s use geopandas to move the prime meridian 10 degrees west:
# reproject the data
gdf_square_10w = gdf_square.to_crs("+proj=longlat +datum=WGS84 +lon_0=-10")

fig, ax = plt.subplots(figsize=(12, 6))
gdf_square_10w.plot(ax=ax)
plt.ylim(38, 50)
plt.xlim(0, 20)
plt.show()
Note the shift in coordinates along x by 10 degrees west.